16-Feb-2026 India and The European Union ink the ‘Mother of all deals’
#tradepolicy #tariffelimination #exportgrowth #globaltradeIndia and the European Union have finalized a landmark Free Trade Agreement at the 16th India–EU Summit, significantly deepening their strategic economic partnership. The agreement is set to eliminate tariffs on nearly 99.5% of Indian exports to the EU in value terms, boosting key sectors such as textiles, gems & jewellery, engineering goods, chemicals, and select agri-products. Beyond trade in goods, the FTA strengthens cooperation in services, investment, professional mobility, digital trade, and sustainability—positioning the India–EU partnership as a strong and future-ready alliance in a shifting global economic order.

A comprehensive overview of the deal, supported by data-led economic insights
The centrepiece of recently held 16th India–EU Summit, India is undoubtedly the EU India Free Trade Agreement (FTA) that was concluded on 27 January 2026. Portrayed as the “mother of all deals,” the agreement represents a major step forward to deepen strategic economic partnerships between India and European Union (EU).
The FTA clearly brings together two diverse but major economic powers having a combined market that is estimated at over USD 24 trillion promising to unlock immense gains from trade. In a trade economic theory parlance, the pact offers great opportunity for Indian sectors, particularly labour-intensive sectors to reap incredible gains from trade due to their relative comparative advantage in a truly Ricardian sense. While the deal took almost two decades to finalise, the talks gathered momentum only in the past few years and its conclusion could not be more timely, given the current strain on the international rules-based order, trade fragmentation, rapid technological change, and shifting geopolitical dynamics. The pact brings hope in such uncertain times as two major economies join hands to uphold a rules-based partnership, reinforce trade integration in goods, services, human capital, technology, supply chain integration and sustainability, unleashing a huge mutual market access potential.
While the fine print of the FTA is awaited, the agreement is estimated to deliver extensive tariff elimination, with the EU’s average tariff rate on Indian goods dropping from 3.8% to 0.1%[1].
The EU made landmark commitments to allow preferential access to India on over 90% value of Indian exports immediately on entry into force that subsequently extend to 93% of exports value followed by further tariff relaxations, that will cumulatively translate to a whopping 99.5% exports from India to the EU bloc, in value terms. A major impetus is expected to labour intensive sectors like textiles, footwear, leather items, gems and jewellery and Indian agricultural products through preferential access for tea, coffee, spices, fresh fruits and vegetables and processed food. Likewise, India has agreed to scrap or reduce tariffs on over 97% of EU exports.
- 1. Snapshot of key Sectoral outcomes from the trade deal
The below table give a snapshot of the key sectoral outcomes from both sides due to this FTA partnership.
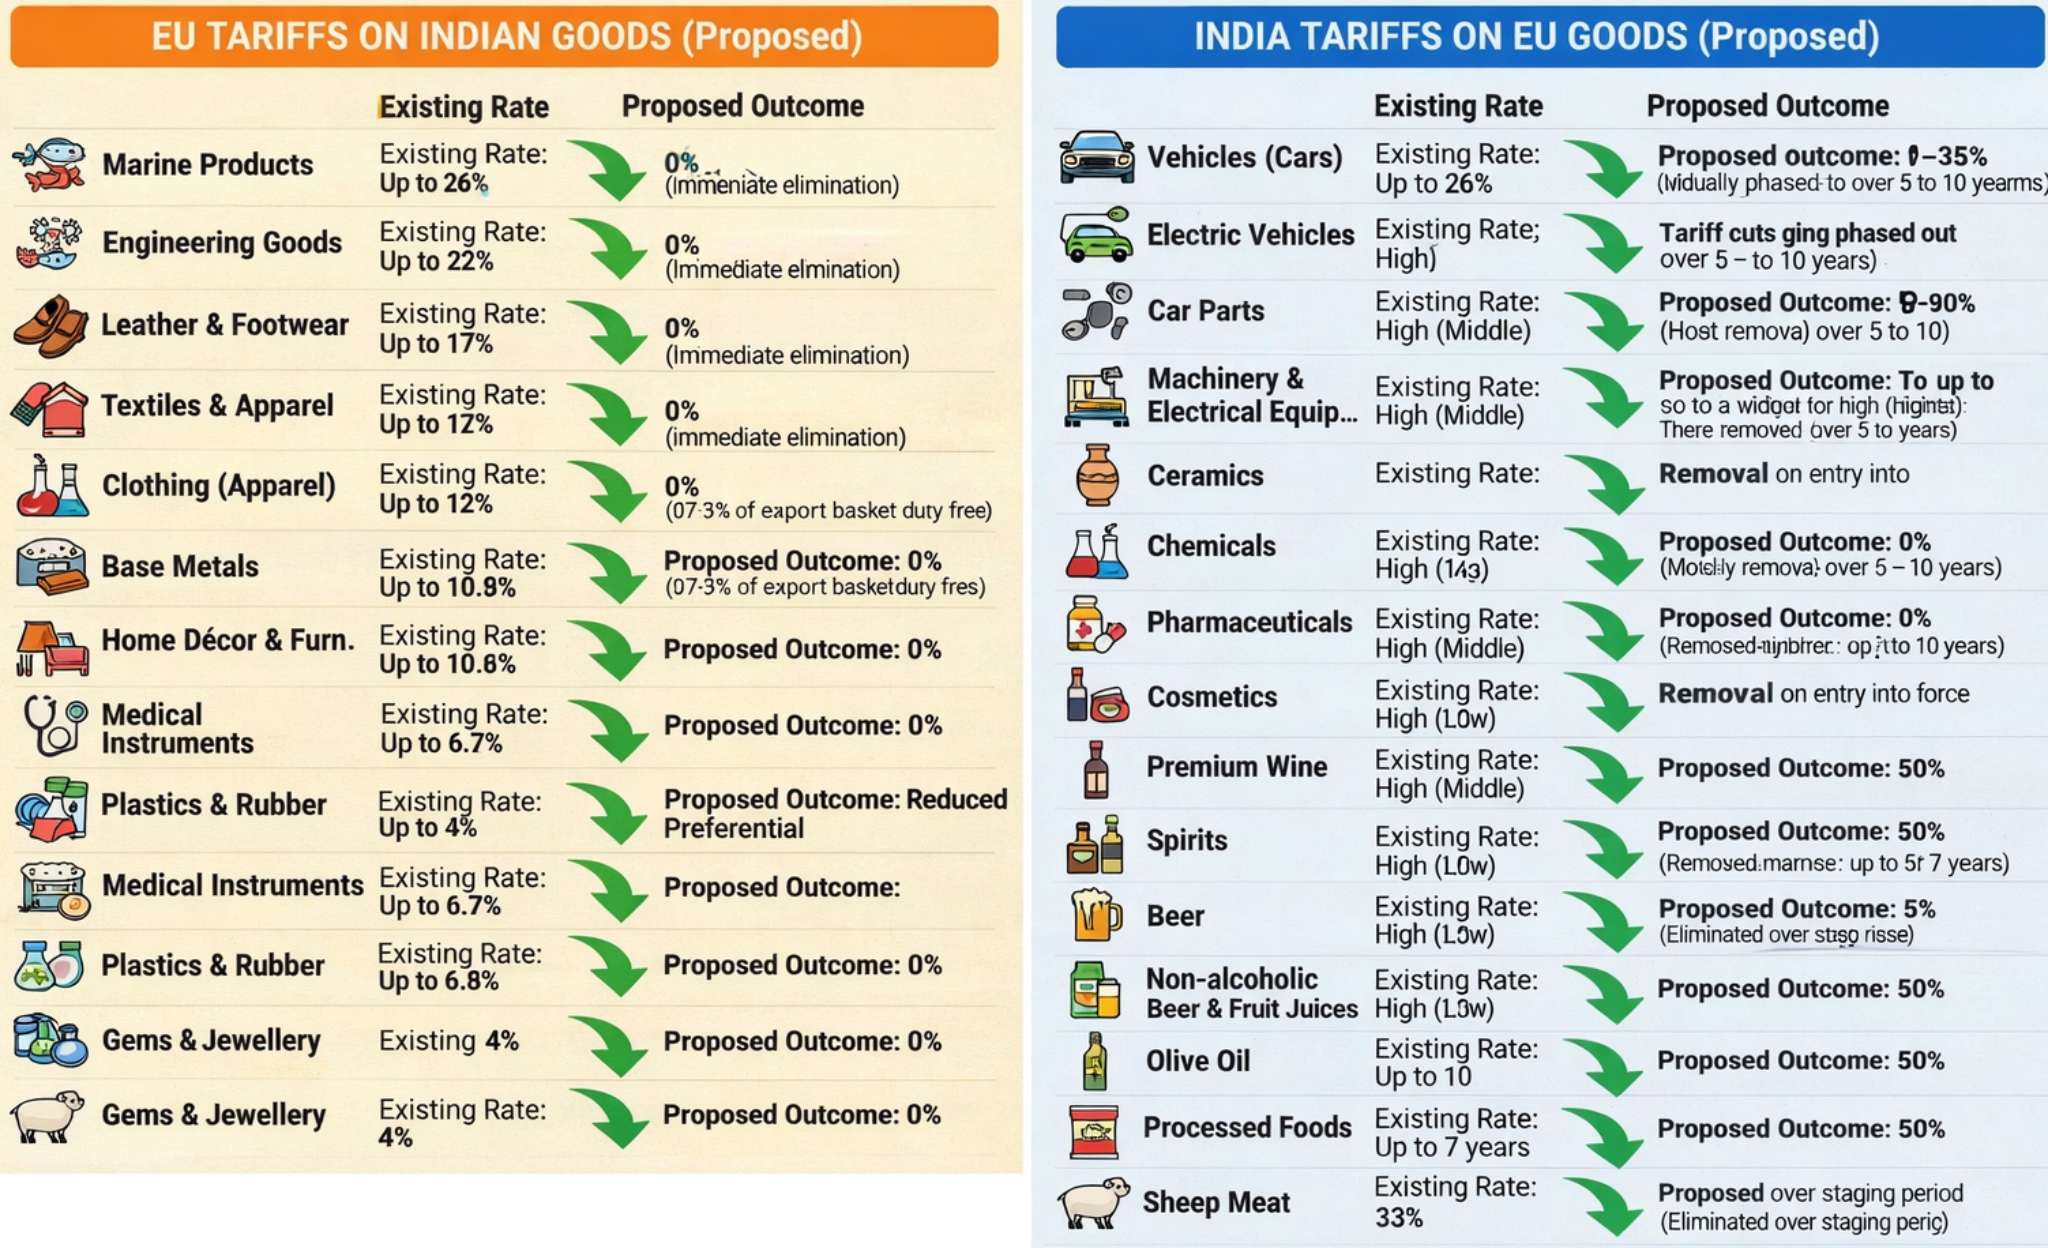
Figure 1: Snapshot of key sectoral outcomes of the FTA deal
Data sources:
1) MEMO: EU-India Free Trade Agreement: Chapter-by-Chapter Summary, European Commission
2) Factsheet of the India-EU FTA issued by Ministry of Commerce and Industry, Government of India,
3) Details of EU-India trade deal, Reuters
2. What numbers are we talking?
India and EU are touted as natural trade partners witnessing exports from India of around USD 79 bn. and USD 67 bn. during 2024 and 2025 (year-to-date November 2025) respectively and imports into India of about USD 58 bn. and USD 60bn. respectively during 2024 and 2025 (YTD), fetching India a trade surplus of around USD 20bn. in 2024 and USD 7 bn. in 2025 (YTD). The table below shows how exports from India to EU in value terms in the top 20 HS-4digit headings account for more than 55% of total value of exports comprising of 1100 plus headings. At the same time, one witnesses reciprocal exports and imports under same heading hinting towards close cross-border supply chain integration ex-ante between these partners. A graphical representation of top 10 products exported from India and imported from EU is presented below.
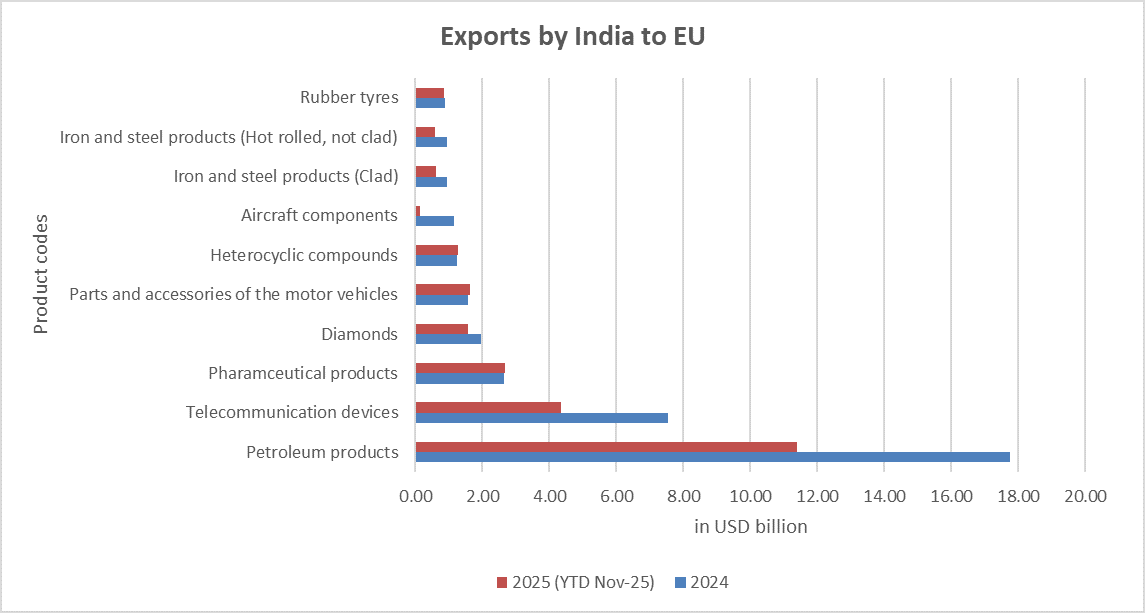
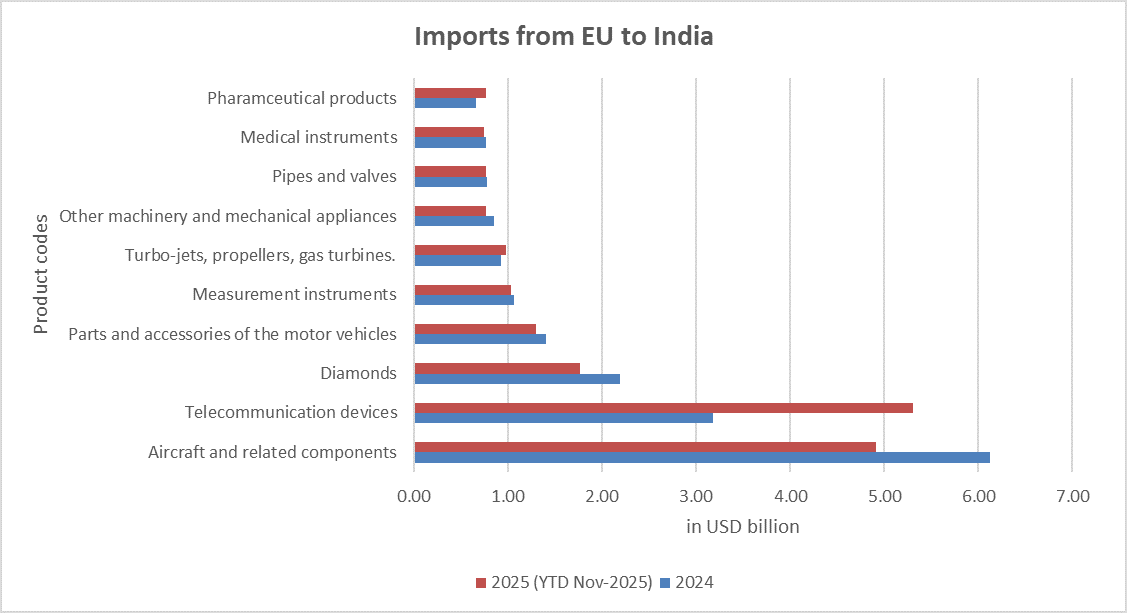
Figure 2: Top 10 export and import products between India and EU
Data source: Trade Intelligence and Analytics Portal, Ministry of Commerce and Industry, India
Beyond the headlines and handshakes, the real story lies in the economic indicators that show why this agreement truly matters for both sides. Today we attempt to give a non-technical prelude to some of the preliminary economic trade indicators that play a key role in evaluating trade agreements. Intriguingly, an assessment of these indicators offers compelling positive outlook for the India–EU trade agreement.
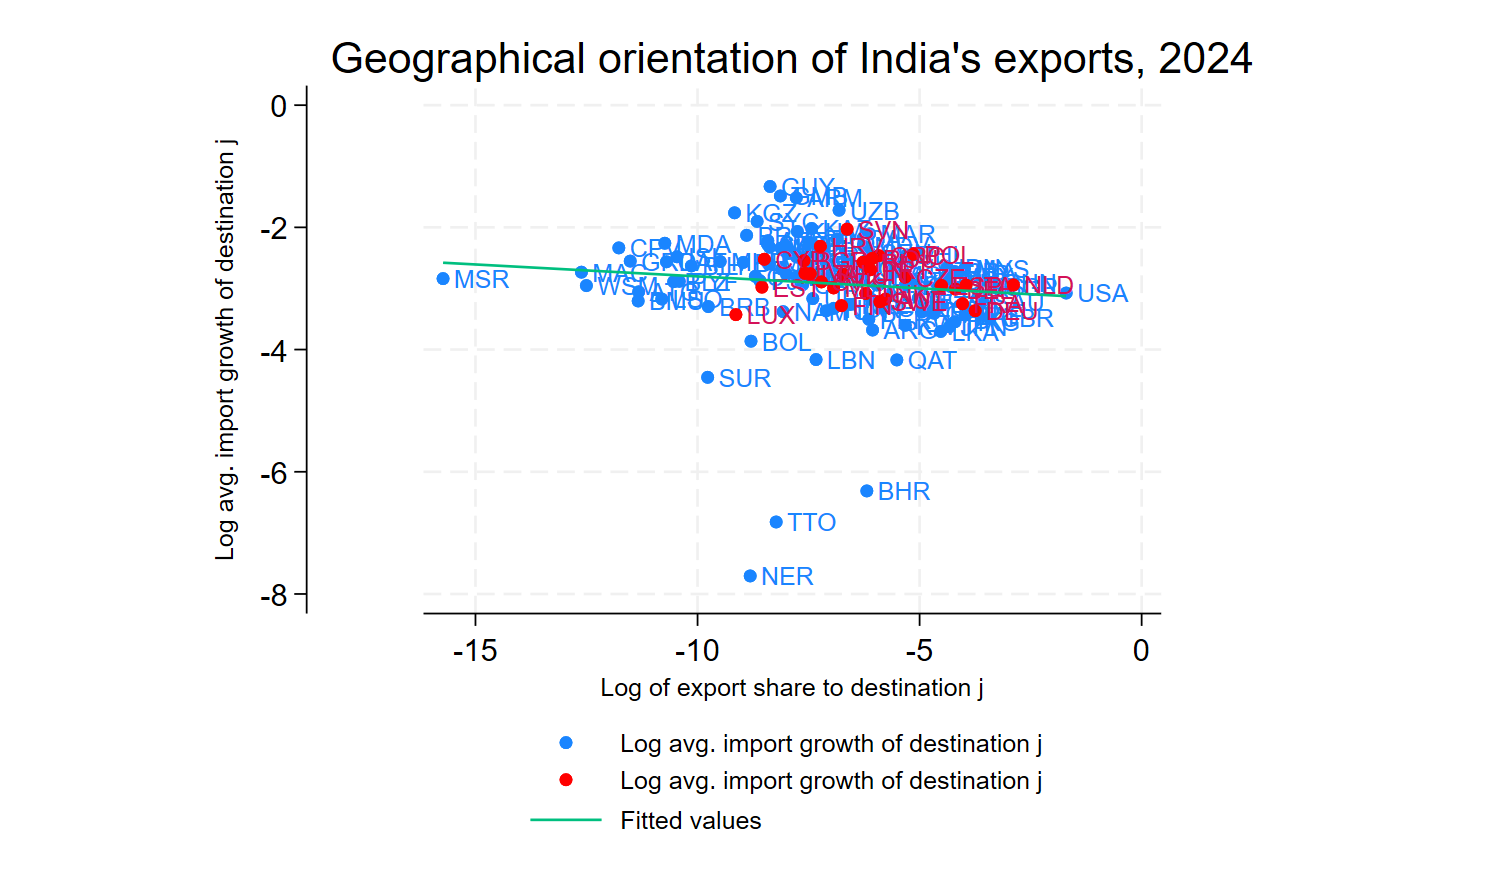
A) Geographical allocation of exports: It is always favourable for any trading nation to have larger share of exports directed towards countries having high growth potential which shows up in their high year-on-year import demand. Based on our analysis for 2024, we find India’s exports are slightly leaning towards low-growth developed nations which includes European Union bloc. The current FTA is expected to further accelerate Indian imports through greater market penetration in EU by reducing tariff barriers.
B) Comparative advantage: In simple terms, comparative advantage refers to a relative economic advantage (specialisation) enjoyed by a country over other countries in relation to a particular traded good. Theory suggests that trade unlocks more value when two countries specialising in distinct goods / sectors open to trade. This advantage is typically measured by something called as revealed comparative advantage (RCA). A product-level RCA greater than 1 suggests strong competitiveness for the country in that sector worldwide.
From our analysis of India’s all sectoral RCAs, we find that substantial share of India’s exports to the EU already lies in sectors where India demonstrates strong structural competitiveness. Fortunately, about 48% of India’s exports to EU (per 2024 data) have RCA values well above 2, and in several product categories, extend into double digits, indicating deep-rooted export specialisation. Some of these labour-intensive and cluster-based industry sectors, include woven fabrics, fibre, wool, yarn, other textiles, cooking oils, iron & steel and rice. The tariff cuts introduced under the FTA are expected to amplify sectors where India is already enjoying a relative comparative advantage over EU.
C) Matching trade needs: This relates to how well two countries’ trade needs match each other i.e. what one country sells matches what other country wants to buy. Technically, it is called ‘trade complementarity’ index and performed for both channels viz. India export - EU imports (export side) and EU exports – India imports (import side). If the match is perfect, there is ‘high trade complementarity’ between the trading partners depicting them as natural partners, and not in case otherwise. Our analyses show a moderate match on both export and import side of India.
The trade complementarity indices are moderately pegged around 40-42 on both sides, suggests a balanced trade structure, a diversified trade portfolio without domination by any single commodity of either partner. More importantly, this suggests an untapped trade potential between the India and EU that the instant FTA now seeks to unlock.
A detailed technical explanation of these indicators is relegated to a separate Appendix below the article.
Based on the preliminary analyses, a review of FTA impact on some of the marque sectors for India is presented below:
- 1. Textiles & Apparel
The tariff elimination for textiles and apparel is not just a market-opening measure, it amplifies India’s already strong export specialization in these sectors, where RCA values frequently exceed 5 and in some product lines rise into double digits. This suggests that Indian firms are structurally well-positioned to scale exports once tariff barriers fall.
2. Gems & Jewellery
This is a sector where India’s RCA values are among the highest in its export basket and with tariff elimination in the EU market, it is likely to translate directly into export expansion, given the sector’s entrenched global competitiveness and strong cluster-based production networks. India’s gems and jewellery sector exhibits some of the strongest RCA values across all exports, underpinned by specialised processing clusters and skilled labour. Tariff elimination in the EU market therefore directly enhances an already competitive export segment. Exporters in this space should focus on branding, traceability, and compliance with evolving sustainability and sourcing standards to consolidate market share in high-value EU segments.
3. Steel & Metals
India’s steel exports become far more competitive as EU duties (up to 22%) are phased out. This opens opportunities in flat and long steel products. However, CBAM still applies to steel, so mills must track carbon emissions in production. We advise producers to start carbon accounting now (fuel use, efficiency measures) and consider “green steel” investments for a premium market. Watch for any new quotas or staging in the final schedule. (For example, phased duty cuts may apply to specialized alloys.) Our team can model how EU tariff changes affect your pricing and help negotiate any quota allocations.
4. Chemicals, Pharma Intermediates
India’s chemical and pharmaceutical intermediate exports already exhibit strong revealed comparative advantage across several HS categories. The FTA’s tariff reductions in chemicals and pharmaceuticals therefore reinforce an existing export strength rather than creating a new one. For Indian firms, this presents an opportunity to expand participation in European value chains, particularly in generics, specialty chemicals, and intermediates. At the same time, exporters must remain attentive to the EU’s stringent regulatory regimes, especially REACH and pharmaceutical quality standards, as tariff access does not dilute compliance requirements.
5. Engineering Goods
While engineering goods are a broad category, RCA analysis suggests India’s competitiveness is concentrated in specific segments such as auto components, certain machinery parts, and metal-based manufactures. The FTA is likely to deepen India’s role in EU-linked supply chains particularly in these niches. Firms in these areas should position themselves as reliable suppliers in just-in-time European manufacturing networks, investing in quality certification, digital supply-chain integration, and long-term contracts with EU buyers.
6. Agro & Marine
In agriculture and food products, India’s comparative advantage is more selective but notable in items such as coffee, spices, and certain marine products. Preferential EU access in these categories could translate into higher rural value realization, especially where India combines climatic advantage with established export networks. However, success in these segments will depend not only on tariffs but also on strict adherence to EU sanitary and phytosanitary standards, traceability norms, and sustainability expectations.
Overall, sectors such as textiles, garments, footwear, and leather products stand out both in terms of tariff elimination and underlying comparative advantage. India’s RCA values in multiple textile and apparel lines are among the highest in its export basket, reflecting entrenched production ecosystems and cost competitiveness.
With EU duties in these segments being reduced to zero, Indian exporters gain a decisive price advantage over non-FTA competitors. For firms in these sectors, the priority should now shift from market entry to scaling capacity, upgrading design and quality standards, and integrating more deeply into European retail and sourcing networks.
3. Investments, Services, Mobility and Talent
The agreement creates a comprehensive framework for services, which is a dominant sector for both economies.
a) Market Opening: The EU has granted India access to 144 service sub-sectors, while India reciprocally opened 102 sub-sectors to the EU, including financial, maritime, and telecommunications services. Regulatory stability is expected augment FDI inflows and particularly give boost to Indian automobile and machinery industry.
b) Professional Mobility: The deal facilitates movement of professionals, establishes a regime for temporary entry of business visitors, intra-corporate transferees, and independent professionals (in sectors like Information Technology and R&D).
c) Traditional Medicine (AYUSH): Indian practitioners of traditional systems of medicine (AYUSH) will be allowed to provide services in EU member states where the profession is unregulated, and to establish wellness centres.
d) Social Security: Both sides agreed to a framework to enable Social Security Agreements within five years to protect the interests of cross-border workers.
4. Strategic Exclusions and Safeguards
Both parties have retained "policy space" to protect sensitive domestic industries.
a) Indian Agriculture: India successfully excluded sensitive sectors such as dairy, beef, poultry, cereals, sugar, and soymeal from tariff elimination.
b) EU Agriculture: The EU retains protections for its own sensitive goods, including beef, rice, sugar, and olive oil through a staged elimination.
c) Trade remedies: Typical of any other trade agreement, both India and EU have retained their right to employ trade remedy measures to protect their respective domestic industries from injury caused by unfair trade practices in the counterpart, to sustain fair competition and stability for local industries.
5. Carbon Tax and Carbon border Adjustment Mechanism:
There is no direct relief on Carbon Border Adjustment Mechanism (CBAM) under the FTA. The EU’s CBAM, conceived to align with its 2050 climate ambitions with competitive neutrality and mitigate carbon leakage, has been operational from January 2026. It currently focuses on six industries– Iron and steel, Aluminium, Cement, Fertilizers, Electricity and Hydrogen. However, as part of the partnership, EU has expressed its openness to extend technical support to evolve India’s Carbon Credit Trading System (CCTS) initiative and inter alia on MRV (monitoring, reporting and verification) requirements for better alignment with CBAM. The EU has also committed to extend to India any preferential treatment that it may grant to other countries in the future. It is pertinent to note that there are structural and ideological differences between India’s intensity-driven, baseline-and-credit oriented CCTS and European Union’s economy-wide cap-and-trade system supported by the EU ETS. Among many environmental economists, there is lingering scepticism regarding effectiveness of CCTS in reducing carbon emissions. Design divergences are likely to sustain a systematically large carbon price differential between the two frameworks / markets at least in the near to medium term. This is particularly attributable to the seemingly generous intensity targets under India’s CCTS even after transition from Perform, Achieve and Trade (PAT) mechanism, which fail to impose a meaningful carbon cost, even on hard-to-abate even on hard-to-abate industries[2]. The scheme remains institutionally nascent, lacks market depth, and therefore generates subdued carbon price signals.
Accordingly, in the interim, this price differential, together with methodological divergences, may constrain the effective recognition or offsetting of carbon credits generated under India’s CCTS against the EU’s CBAM for carbon-embedded imports into the EU.
The below table shows India’s exports to EU in CBAM exposed sectors over 2021 – 2025 (YTD)
Product Category 2021 (USD Mn.) 2022 (USD Mn.) 2023 (USD Mn.) 2024 (USD Mn.) YTD 2025 (USD Mn.) Aluminium and Related Articles 1,650.48 2,747.84 982.57 1,111.96 874.62 Fertilisers 1.28 1.82 2.90 2.01 4.04 Iron and Steel 5,780.06 4,156.09 4,316.99 3,959.47 3,103.91 Cement Products 4.80 5.49 9.15 13.75 15.19
Data source: Trade Intelligence and Analytics Portal, Ministry of Commerce and Industry, India
6. Rules, Standards and Sustainability
a) Digital Trade: The deal aligns with WTO initiatives, ensuring cross-border data flows, protection of source code, and no customs duties on electronic transmissions.
b) Sustainability (TSD): The Trade and Sustainable Development (TSD) chapter includes binding commitments to the Paris Agreement and core ILO labour conventions (including women's empowerment and abolition of child labour).
c) Dispute Settlement: Disputes will be handled by independent panels with binding rulings to ensure enforceability.
7. How Indian exporters should gear up?
Indian exporters who are eyeing to make the best out of this FTA need to initiate early conversations with experts around –
a) Origin rule compliances and value-addition requirements in certain sectors (like textiles and apparels) to qualify as Indian-origin
b) Technical gap analysis for sectors subject to regulatory, food safety and health compliances, related sanitary and phytosanitary (SPS) measures, sustainability, labelling and other non-technical barriers (NTB) to trade, to match EU standards and norms
c) Conducting product-level tariff impact analysis, supply chain planning, market access evaluation, mapping FTA benefits with its phase-in schedules and quotas, identifying duty savings and advantageous priority sectors through intensive RCA analysis
d) Engaging in pricing revisions reflecting tariff revisions to build product competitiveness and instructing legal and procurement teams to revise contractual arrangements
e) Strengthening carbon management systems, supply chain transparency, and carbon cost accounting frameworks to ensure readiness for reporting embedded emissions and addressing potential EU carbon levies under the Carbon Border Adjustment Mechanism (CBAM), particularly in the six covered sectors.
8. Conclusion
Overall, this FTA represents a significant diversification strategy for both partners. For the European Union, it secures access to a massive growth market for its high-value industrial and premium consumer goods. For India, it provides crucial duty-free access for its manufacturing exports while facilitating the global mobility of its skilled workforce.
The convergence of strategic interests and geopolitical pragmatism appears to have provided strong stimulus for the two economies to deepen their economic ties. While certain gaps and challenges, may temper the pace of immediate gains, the agreement lays a solid foundation for sustained, long-term benefits that are likely to materialise significantly as this partnership gathers momentum. In fact, India-EU has also consolidated its security stance by entering into a parallel Security and Defence Partnership. In that sense, it reflects not only an economic pact but a comprehensive, forward-looking, resilient and strategic alliance that seeks to address a holistic global volatility besides yielding mutual trade benefits over time.
Appendix 1 – Technical explanation on the economic indicators discussed in relation to the EU-India FTA
Evaluation of key trade economic indicators from an Indian standpoint[3]
A brief technical account of some of the preliminary trade indices is captured below. The readers may require some basic understanding of trade theory, basic pre-calculus and beginner level statistics.
A) Geographical orientation of exports
It is important to assess the orientation of India’s exports and the extent to which they are directed toward partners experiencing faster import growth, which serves as a proxy for economic growth. The following scatter plot depicts the log of India’s export share to its various destination partners (say j) along x-axis and corresponding log of average import growth of these partners along y axis. The figure shows a downward sloping fitted line (in green) suggesting India’s exports tilting towards slow-growing but economically significant developed economies including EU (EU countries differentiated by red dots).
Figure 3: Geographical orientation of India’s exports (in 2024)
Data source: UN Comtrade; Trade Intelligence and Analytics Portal, Ministry of Commerce and Industry, India
B) Revealed comparable advantage (RCA) of India across its exports
Comparative advantage describes a country’s ability to produce a good at a lower opportunity cost relative to its trading partners, which forms the basis for specialisation and mutual gains from trade. Since opportunity costs are not directly observable, the Revealed Comparative Advantage (RCA) index was devised by Balassa[4], which infers comparative advantage from trade patterns by comparing a product’s share in a country’s exports to its share in world exports. The index is formulated as follows:
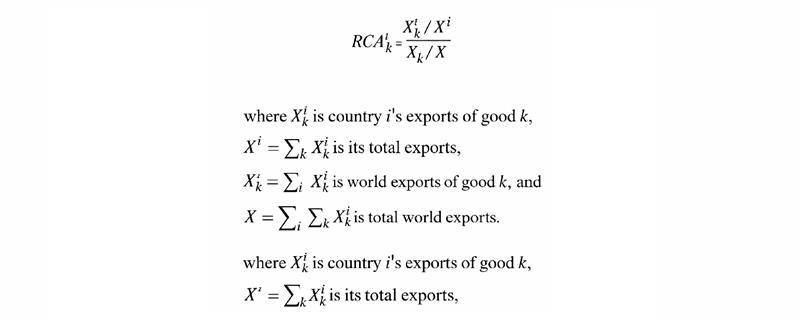
RCA index greater than 1 or rather above 2 explains stronger comparative advantage for India in the product in question. We computed the RCA indices for all products exported by India (represented by HS-4digit and their reported export values) using the data for 2024 and found that products representing more than 48% of the total exports to EU (in value terms) have RCA index greater than 2 and shoots up all the way up to roughly 30, depicting a very strong export specialisation benefit already in favour of India with respect to EU exports, typically seen in labour intensive or cluster-based industries. These products with such high RCA mainly include inter alia textiles, fibre, iron and steel, oils, metals and organic compounds.
A snapshot of top 15 products by RCA and their corresponding exports to EU in 2024:
Product type - 4digit HSN Product description Exports to EU in 2024 (USD Mn.) Revealed Comparative Advantage (RCA) 5310 Woven fabrics, jute, other fibres 15.88 29.55 2942 Organic compound 379.87 28.12 909 Aromatic spices 61.83 26.14 6703 Wool, dressed hair, other animal hair textiles 8.86 24.18 1508 Cooking oil - groundnut oils 0.13 21.49 1203 Dried coconut meat 0.08 18.59 7206 Iron and non-alloy steel in primary forms 180.55 17.65 5305 Natural, non-spun, or processed fibres 71.22 17.58 2516 Building material, stones 40.19 16.74 5203 Cotton fibres 0.68 15.32 5701 Knotted carpets 41.11 15.05 5205 Cotton Yarn 290.40 15.02 6304 Textile material for furnishing homes 312.56 14.01 7104 Synthetic man-made stones 35.04 13.89 1006 Rice 239.94 13.58
C) Trade complementarity between India and EU
Trade complementarity indices (TCIs) measure how best two countries could be seen as ‘natural trading partners’. We computed the trade complementarity index between India (country i in the model) and EU (j), on both import (m) and export (x) side. It evaluates the degree to which the composition of economy j’s exports corresponds to the composition of country i’s import demand. The index of 100 depicts perfect correlation between sectoral shares; whereas zero when there is a perfect negative correlation. Formally, let be product k’s share in India’s (i’s) total imports from the world and its share in EU’s (j’s) total exports to the world. The import TCI between i and j is then:

Corresponding TCI was computed on the export side. For our purposes, we took HS-4digit level data to represent each product k in this model. Using the data from UN Comtrade for the year 2024, TCI index for India on import side (depicting the ability of EU to cater India’s import demand) worked out to 42.33 whereas the TCI index for India’s export side (ability of India to fulfil EU’s import demand) worked out to 40.77.
Here is your content formatted as hyperlinked notes (ready for website/blog use):
- 1. 🔗 Details of EU-India trade deal, Reuters, January 27, 2026.
- 2. 🔗 Industries whose inherent design prevents / limits their decarbonisation efforts both technically and financially.
- 3. 🔗 A Practical Guide to Trade Policy Analysis, United Nations and World Trade Organisation.
- 4. 🔗 Balassa, B. (1965), “Trade liberalisation and ‘revealed’ comparative advantage”, The Manchester School 33: 99–123.